

Kano Analysis
Open Card Sorting
UX Researcher
✺
2022 May
✺
01 From Research to Roadmap
A mixed-methods study that translated mental model to an unified security solution
01 Background
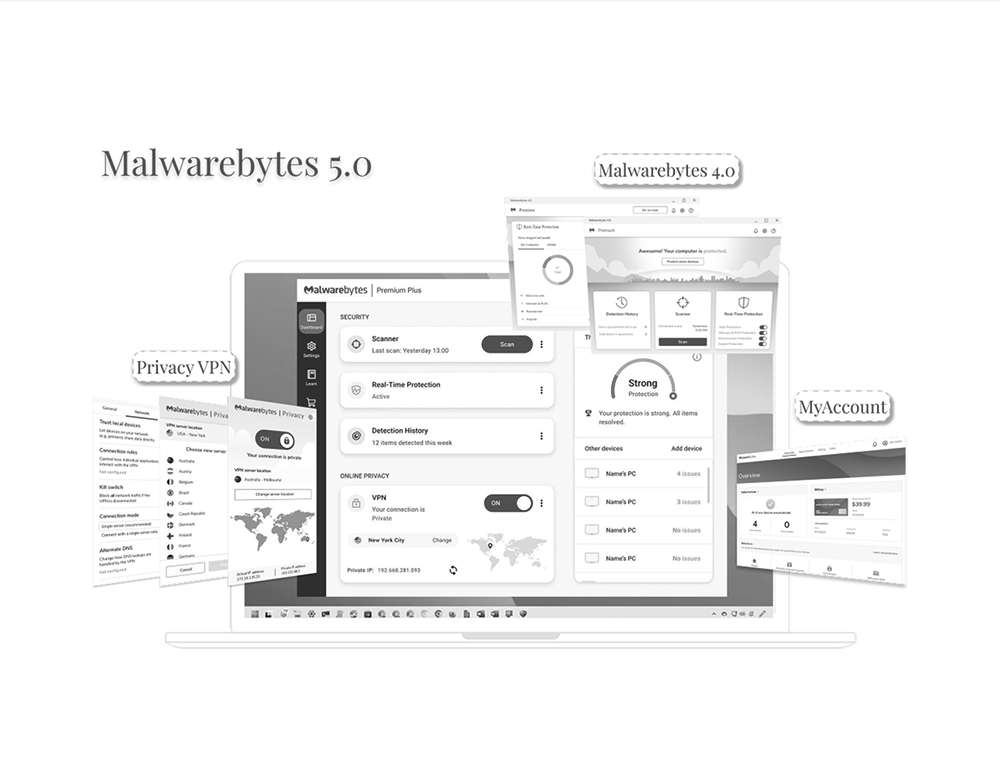
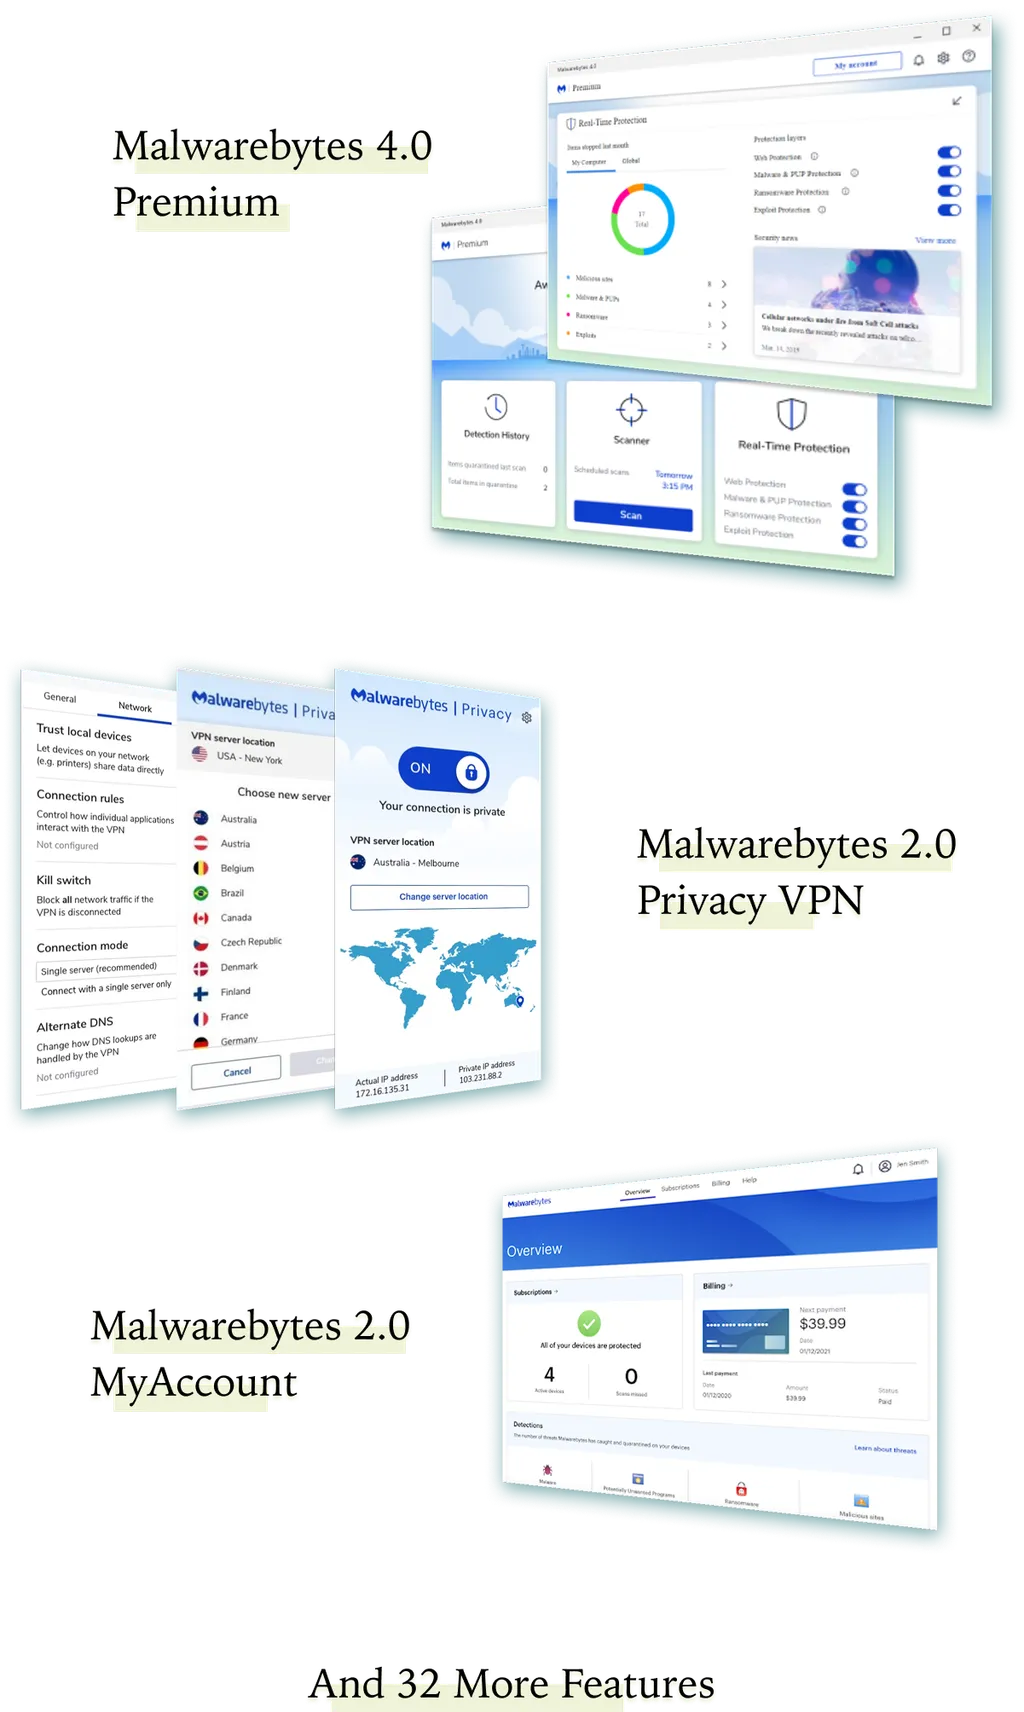
After securing new funding, Malwarebytes began exploring ways to expand its security offerings, especially with a possible shift toward a mobile-first strategy. At the same time, engineers were testing what was technically feasible, but the product team needed clear direction on what users actually wanted.
Prior competor research pointed toward an all-in-one modular security app as a promising direction, but we lacked direct input from users to confirm whether that structure—and the features inside it—would truly make sense to them. Most importantly, we didn’t know which security and privacy needs users found essential, nice-to-have, or unnecessary, or how they naturally grouped and understood these services. This study was launched to fill that gap and ensure our next steps were grounded in real user expectations.

Quick Jump
02 Study Objectives
To address these gaps, I designed a mixed-method study to provide user-centered insights that would guide product development and strategy. Specifically, the study aimed to:

Prioritize 35 security/privacy features based on user needs and expectations.
Understand user mental models to inform the architecture of a unified security app.
Uncover unmet consumer security/privacy needs to refine long-term strategy.
Identify consumer profiles most likely to purchase each portfolio offering to complement targeted marketing and monetization strategies.
✺
03 Methodology
✺
03.a Research Approach
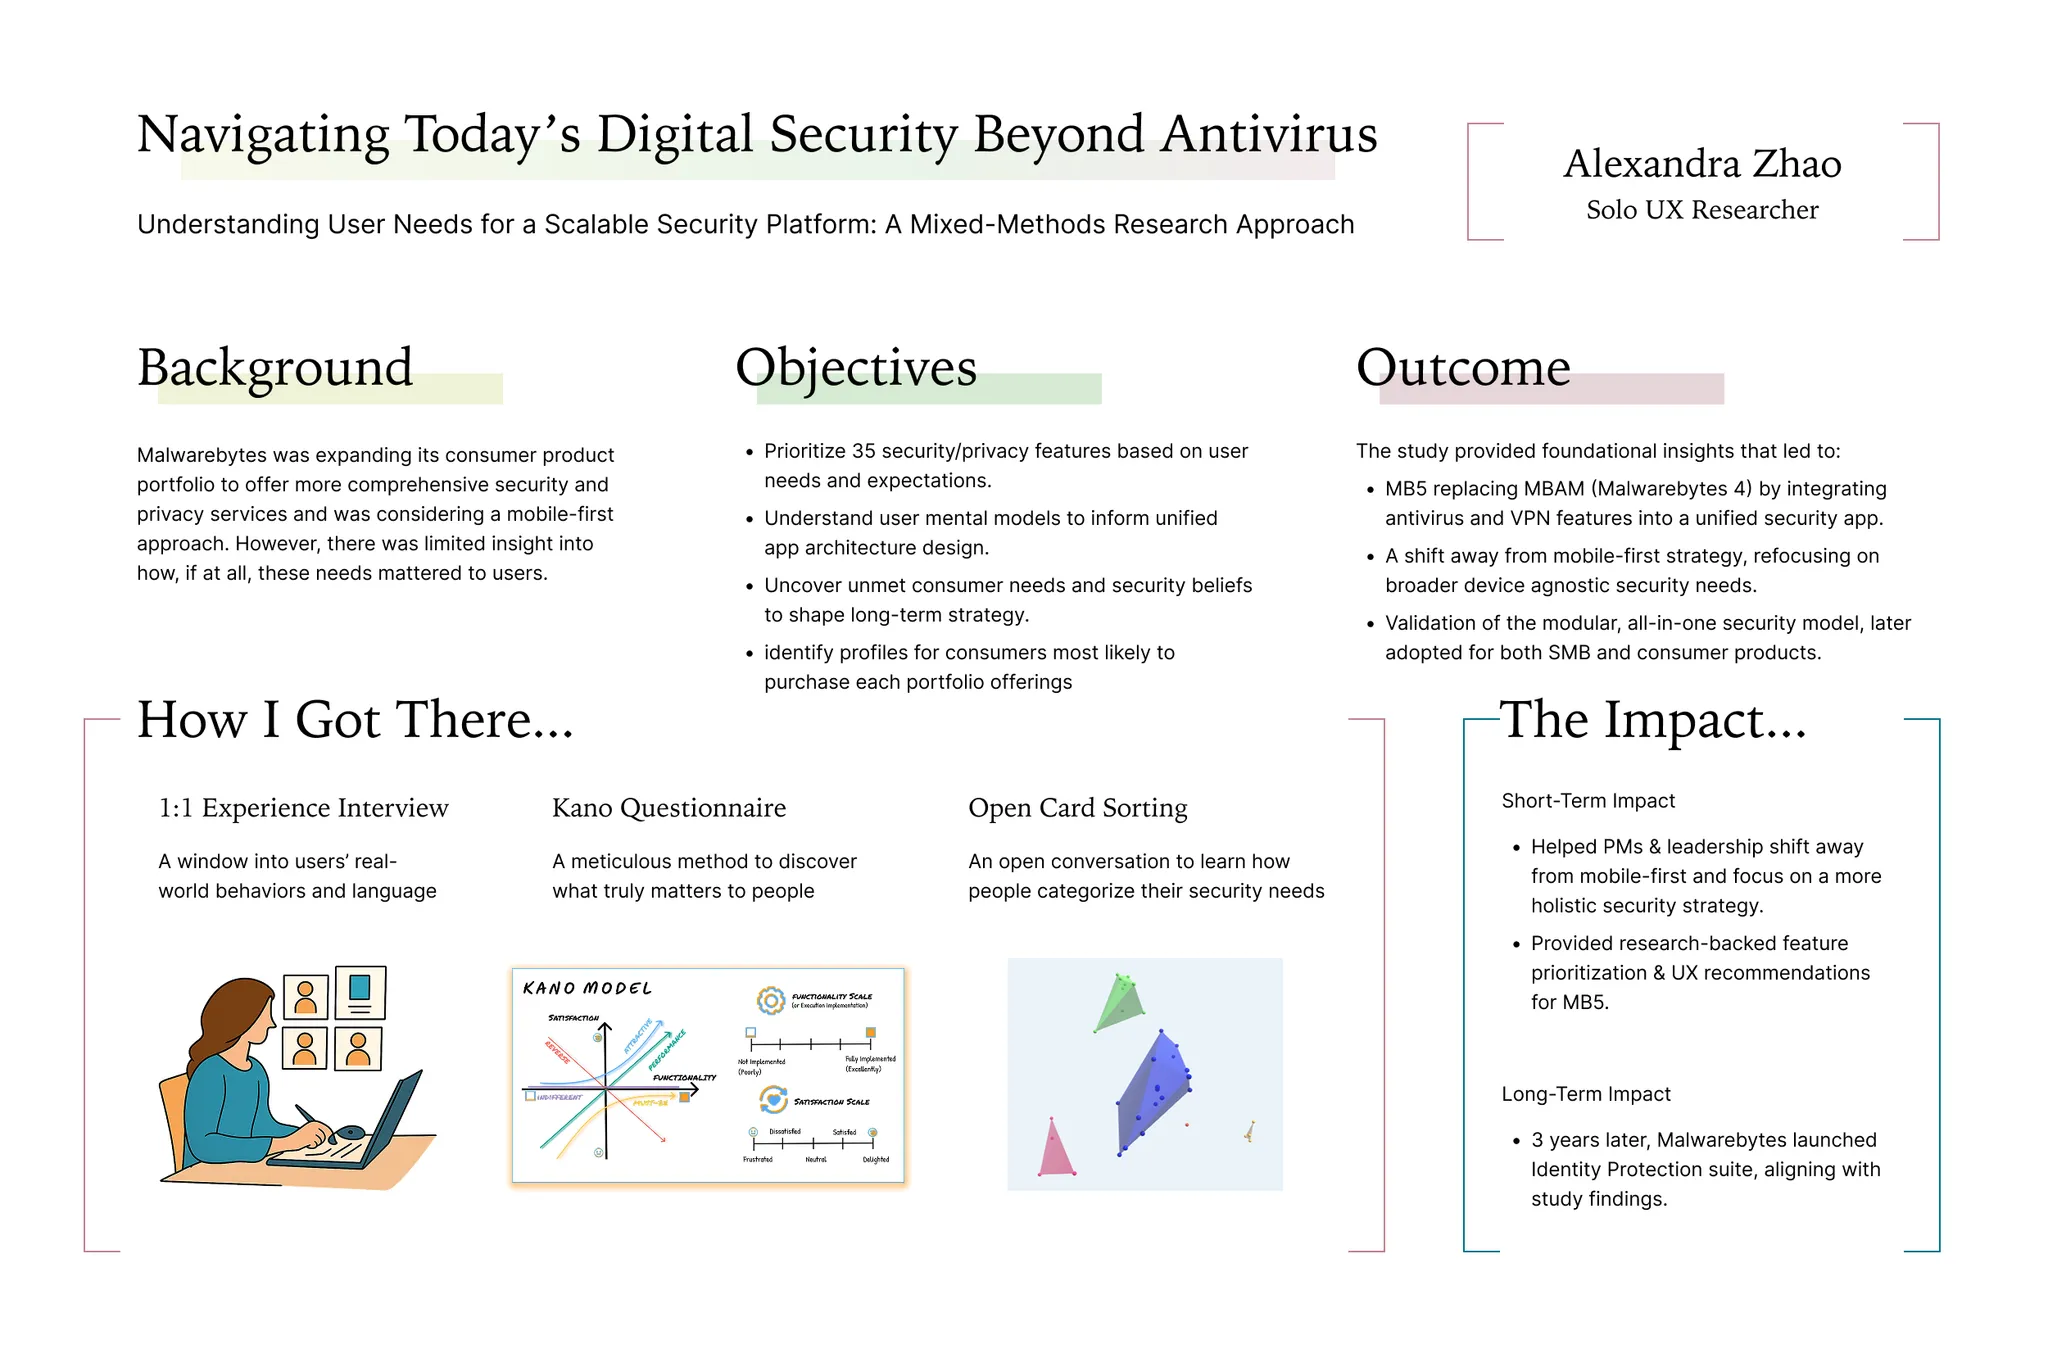
To uncover how users think about digital security and prioritize different features, I designed a two-part study combining qualitative depth with structured, quantifiable input: one-on-one interviews to gave us a window into users’ real-world behaviors and language; and a follow-up card sorting and feature-ranking exercise to map out their mental models that could guide both design and product strategy.
Participants
32 1:1 moderated interviews
8 participants per persona group
Tools
PowerPoint for structured feature slides
Optimal Workshop for card sorting
A custom Kano scoring framework for discrete and continuous analysis.
Structure
5 minutes: Intro and warm-up
First 30 minutes: Kano Analysis (Feature Prioritization)
Last 20 minutes: Open Card Sorting (Mental Model Exploration)
Personas Groups
The Petersons

Vesper

Isaac

Priscilla

03.b Kano Analysis - Feature Prioritization
How It Was Conducted
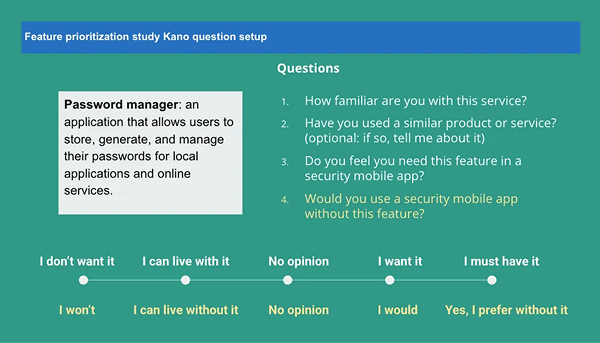
Each participant evaluated 35 potential security features using a structured Kano-inspired questionnaire, presented as a series of interactive slides. This method was used to assess feature desirability and user expectations.
This dual questioning structure allowed me to assign Kano classifications while also gathering real-world commentary to ground responses in personal experience.
03.c Kano Analysis Models
To capture both clear-cut categorizations and subtle preference trends, I used two complementary scoring frameworks:
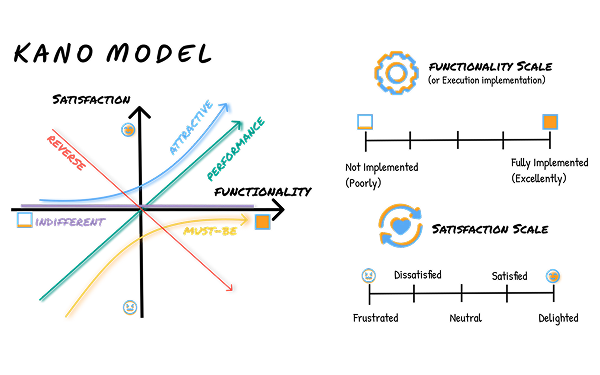
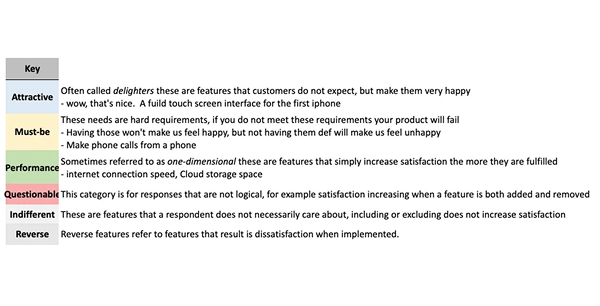
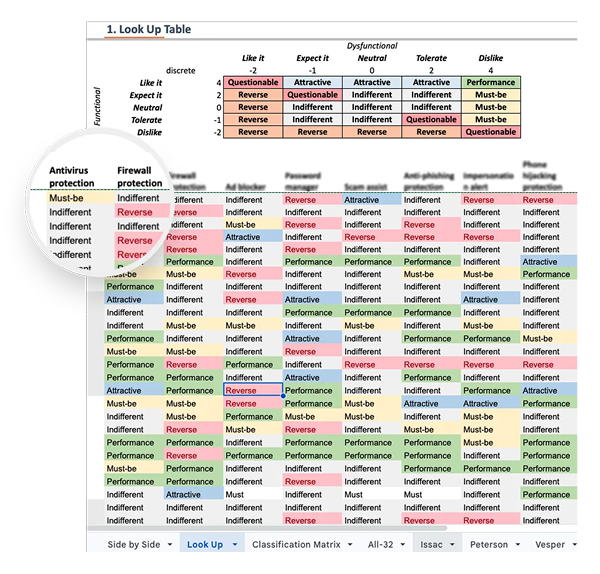
1. Discrete Kano Model
(Category-Based)
Traditional Kano classification where each feature was assigned to one of the six Kano categories (Must-Be, Attractive, Performance, Indifferent, Reverse, Questionable). For each feature, I then calculated the average percent of respondents that gave each of the available classifications. Finally each feature was assigned to the most common classification that it have been given.
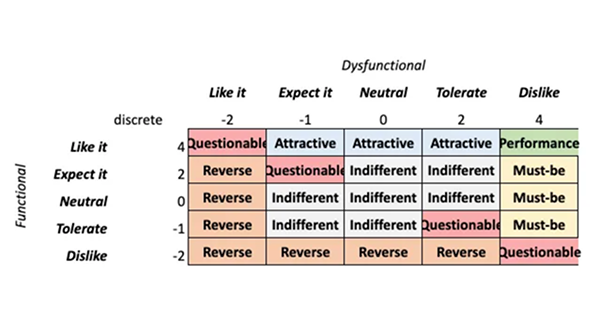
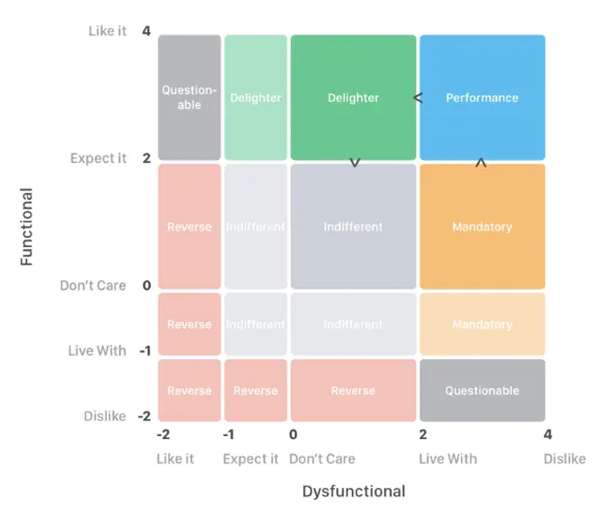
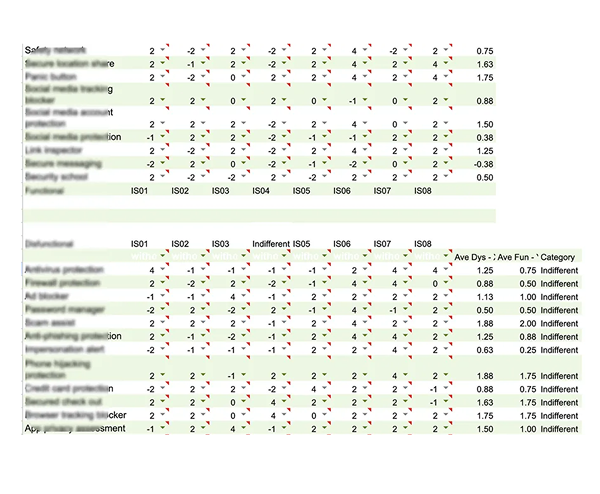
2. Continuous Kano Model
(Scoring-Based)
To revealed nuances in feature prioritization trends beyond simple classification, I applied a numeric scoring model assigning values from –2 to +4 to each response combination. This allowed each feature to be plotted on a desirability scale.
Asymmetrical Weighting Strategy: Because the product goal was adoption and growth, I weighted positive sentiment (Must-Be, Performance, Attractive) more heavily than negative sentiment (Indifferent, Reverse).
Higher scores = Stronger user pull or expectation
Lower scores = Low interest or active rejection
This model revealed relative intensity—some features weren’t just “Attractive,” they were strongly attractive to specific personas.
Prioritize features with adoption-driving potential
Avoid over-penalizing features that some users didn’t actively dislike but didn’t find critical
03.d Kano Analysis Findings
Discrete Kano Model Findings
(Categorical Insight)
Using the classic Kano model, I identified clear differences across personas in how security features were perceived. While most features fell into the Indifferent category overall, a few stood out with strong desirability signals.
Performance Features Across Most Personas
Credit Card Protection, Secured Checkout, and Identity Theft Protection Alerts were consistently rated Performance by all groups, meaning users expected these features to work well and saw their value.
Persona-Specific Must-Be and Delighter Features

Continuous Kano Model Findings (Desirability Intensity)
The continuous model surfaced subtler prioritization patterns and revealed intensity levels that the discrete model couldn’t capture.
Universal Must-Haves
Antivirus Protection, Privacy Guard, and Dark Web Monitoring scored as Must-Be across all users—even though they were labeled Indifferent in the discrete model. This indicates that while users didn’t always articulate these needs, they still viewed them as foundational.
Hidden Priorities
Identity Theft Protection Alerts and Password Manager were rated more highly by Issac and the Petersons, even though they were previously labeled Indifferent.
Consistent with the discrete model, the continuous model showed that Vesper and Peterson users expressed stronger desirability across a broader range of features.
Webcam/Microphone Protection was classified as Indifferent in the discrete model but emerged as a Performance or Must-Be feature in the continuous model across all personas.
Model Comparison & Interpretation
The Discrete Model highlighted clear expectations and classification trends, which are useful for early roadmap decisions.
In contrast, the Continuous Model revealed underlying emotional intensity and revealed features that users cared about but didn’t always articulate.
The continuous model also helped correct for subtle biases in interpretation of the Kano format—especially when participants weren’t familiar with certain feature names or didn’t fully understand the impact of a feature.
This gap often appeared when users were familiar with the feature but didn’t emphasize it in their language. A common trait among less technical or more passive users.
Design Implication
Use the Discrete Model to identify baseline expectations and essential features, and the Continuous Model to fine-tune emotional drivers, segmentation strategy, and onboarding priorities across different user groups.
Overall Takeaways from
Kano Analysis
The Kano analysis revealed that while many features were not actively requested, users still expected a baseline level of protection—especially around identity, privacy, and financial safety. Discrete scoring helped highlight which features users noticed and could articulate, while continuous scoring uncovered deeper expectations that weren't always verbalized. In particular, family users (Petersons) and vulnerable seniors (Vespers) prioritized a broader range of protections, while informed users (Issac) responded more critically to value vs. cost.
Across the board, users favored an all-in-one approach that bundled essential protections—showing strong appetite for a modular, unified security app if framed and delivered effectively.
03.e Card Sorting (Mental Model Analysis)
How It Was Conducted
Participants completed an open card sorting exercise using Optimal Workshop, where they were asked to organize 35 security features into categories that made sense to them. This helped us uncover how users naturally think about different types of protection and which features they group together—critical insights for designing intuitive navigation and modular app structure.
Analysis Techniques
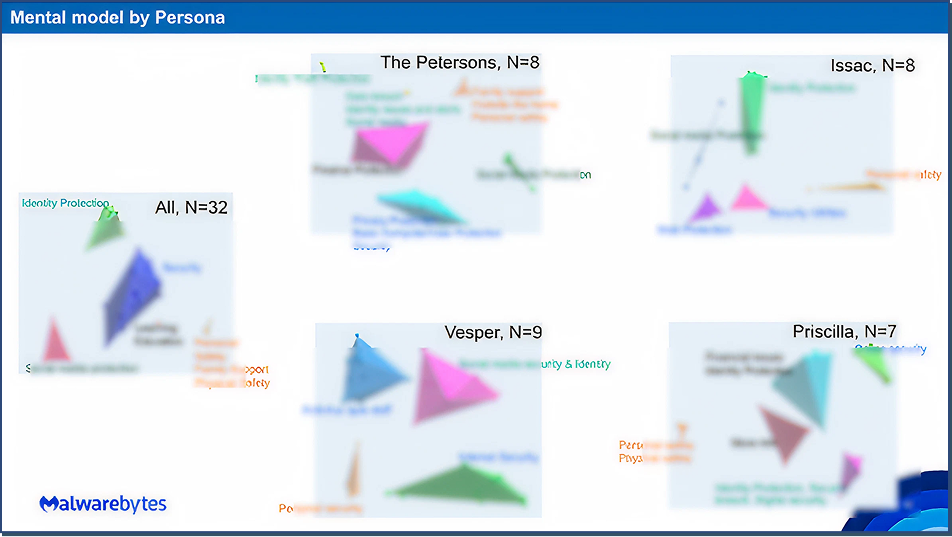
I used Optimal Workshop’s 3D cluster view, which builds on the underlying **similarity matrix (**Measured how often two features were grouped together) to show how often participants grouped features together. This visualization revealed natural mental clusters based on actual user behavior—helping us see not just which features belonged together, but also the strength and consistency of those associations.
While Optimal Workshop provides multiple analysis tools, the 3D view offered the most intuitive and visually engaging representation, making it easier to identify cross-persona patterns and structure features into user-friendly modules.
Key Findings
✺
Users organized features by perceived function and personal relevance, not by technical categories.
For example, “Webcam Protection” and “Microphone Protection” were almost always grouped with Privacy Guard and Secure Messaging, suggesting users associate them with personal intrusion prevention rather than system-level protection.
✺
Clusters often reflected tangible threats or life events.
Participants created categories like:
“Identity Protection” → Included features like ID Theft Alerts, Credit Monitoring, Full Identity Restoration
“Payment Safety” → Often included Credit Card Protection, Scam Assist, and Secured Checkout
✺
Several advanced security terms (like "Credential Breach Alerts" or "Biometric Breach Monitoring") were misunderstood or scattered across groups.
This suggests a knowledge gap that could be addressed through onboarding or in-product education, especially for less technical personas.
Persona-Level Observations
Petersons
(Family Users)
Created more categories tied to everyday risks—e.g., kids’ safety, online shopping, fraud prevention. Groupings were intuitive and scenario-based.
Vespers
(Vulnerable Seniors)
Often grouped by ease of understanding—features they recognized (e.g., “Call Blocking”) were grouped tightly, while unfamiliar terms were often left ungrouped or placed randomly.
Issac
(Informed Power Users)
Created precise, system-oriented categories, often mirroring how features might be organized in a professional dashboard or settings panel.
Priscilla
(Passive User)
Created fewer groups overall and often labeled them with broad categories like “Safety” or “Helpful Stuff”—suggesting the need for simpler navigation and pre-bundled recommendations.
Design Implication
These insights directly informed the information architecture for a unified security app. Instead of organizing features by technical domains (e.g., network, device, identity), we explored a modular system based on user mental groupings—like “Identity Protection,” “Security,” “Privacy Settings”, “Protection for me” and “Learning”.
This user-driven structure also supported:

Personalized onboarding, showing only the most relevant feature clusters
Expandable modules that could introduce new services without overwhelming users
Segmented communication strategies for personas with lower tech familiarity
✺
04 Finding Summary
✺
This study revealed how users think about digital security, not just which features they want, but how they expect those features to be organized, delivered, and explained. By combining feature prioritization data with insights into users’ mental models, we uncovered key expectations that shaped both product design and strategy.
04 Key Findings
Baseline protection is expected—even if not explicitly requested.
Features like antivirus and dark web monitoring were often labeled Indifferent, but continuous Kano analysis revealed users saw them as essential.
Different personas prioritize differently.
Family users and vulnerable seniors valued a broader set of protections. Power users were more selective, emphasizing functionality and pricing.
Users think in terms of life situations, not technical categories.
Card sorting showed users grouped features by scenarios like identity theft, financial safety, or child protection—not by system architecture.
Feature names affected perceived value.
Advanced tools like biometric breach alerts were deprioritized when users didn’t fully understand what they did—pointing to a gap in education and onboarding.
Security is seen as cross-platform, not mobile-specific.
Users viewed digital protection holistically, influencing a strategic pivot away from a mobile-first approach.
Users preferred an all-in-one, modular security app.
This validated the unification of Malwarebytes Antivirus and PrivacyVPN into MB5, and informed the modular UX framework later used for SMB offerings.
✺
05 Impact
✺
Immediate Impact
PMs and leadership reconsidered the mobile-first strategy, shifting to a broader security approach.
Informed Project Flywheel and the design direction of MB5 (Malwarebytes 5.0).
Supported UX decisions around onboarding, information architecture, and feature bundling.
Long-Term Impact
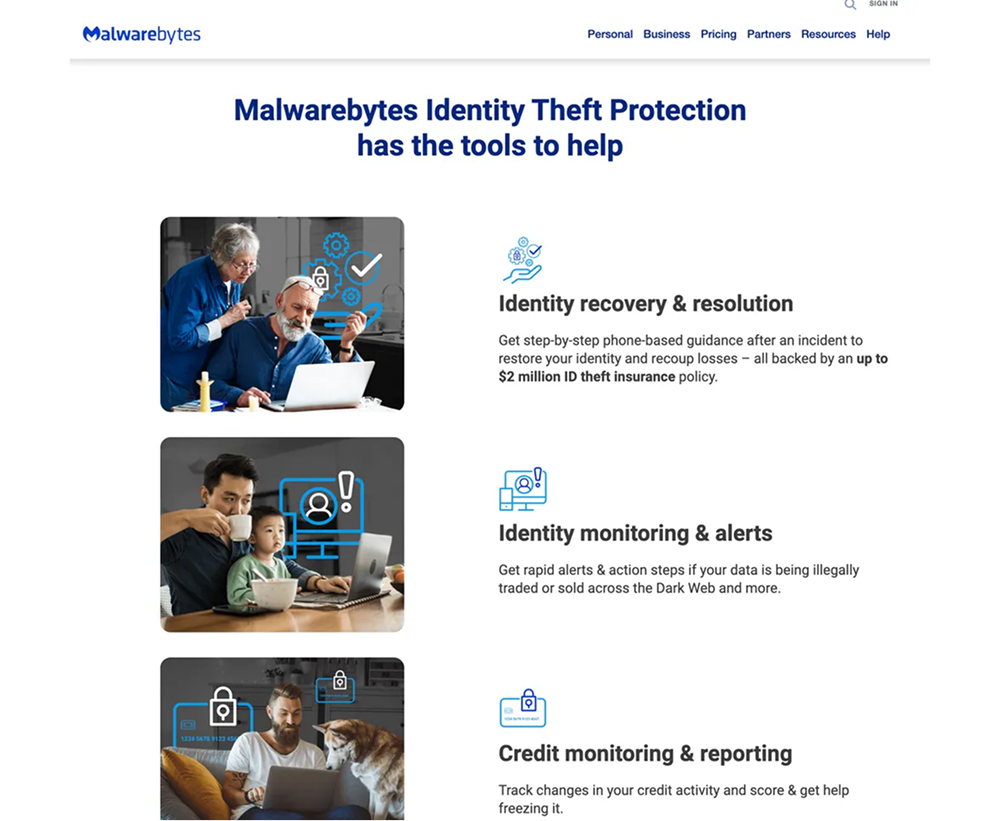
3 years later, Malwarebytes launched Identity Protection (Identity Theft Protection, Personal Data Remover, Dark Web Monitoring, etc)—features that aligned with findings from this study.
The study validated the all-in-one modular security approach, which later influenced SMB product designs.
✺
06 Reflection
✺
06 What Worked Well?
Two Kano models (Discrete & Continuous) provided richer insights.
Segmenting results by persona revealed critical differences in user needs.
Findings directly influenced strategic shifts.
What I Would Change?
While the depth of the 1:1 sessions added immense value, conducting all 32 interviews myself made this project especially time-intensive. If I were to do it again, I would explore using a semi-moderated survey approach—combining open-ended questions with structured card sorting and Kano-style feature evaluation in an asynchronous format.
This would allow us to reach a broader sample with fewer scheduling constraints while still capturing both qualitative insights and quantifiable data. I’d still keep a smaller subset of live interviews to gather rich context, but using a hybrid method could significantly improve scalability without sacrificing depth.

© 2025 Alexandra Zhao

Projects
ABOUT
Resume
Connect
Kano Analysis
Open Card Sorting
UX Researcher
✺
2022 May
✺
01 From Research to Roadmap
A mixed-methods study that translated mental model to an unified security solution
01 Background
After securing new funding, Malwarebytes began exploring ways to expand its security offerings, especially with a possible shift toward a mobile-first strategy. At the same time, engineers were testing what was technically feasible, but the product team needed clear direction on what users actually wanted.
Prior competor research pointed toward an all-in-one modular security app as a promising direction, but we lacked direct input from users to confirm whether that structure—and the features inside it—would truly make sense to them. Most importantly, we didn’t know which security and privacy needs users found essential, nice-to-have, or unnecessary, or how they naturally grouped and understood these services. This study was launched to fill that gap and ensure our next steps were grounded in real user expectations.

Quick Jump
02 Study Objectives
To address these gaps, I designed a mixed-method study to provide user-centered insights that would guide product development and strategy. Specifically, the study aimed to:
Prioritize 35 security/privacy features based on user needs and expectations.
Understand user mental models to inform the architecture of a unified security app.
Uncover unmet consumer security/privacy needs to refine long-term strategy.
Identify consumer profiles most likely to purchase each portfolio offering to complement targeted marketing and monetization strategies.
✺
03 Methodology
✺
03.a Research Approach
To uncover how users think about digital security and prioritize different features, I designed a two-part study combining qualitative depth with structured, quantifiable input: one-on-one interviews to gave us a window into users’ real-world behaviors and language; and a follow-up card sorting and feature-ranking exercise to map out their mental models that could guide both design and product strategy.
Participants
32 1:1 moderated interviews
8 participants per persona group
Tools
PowerPoint for structured feature slides
Optimal Workshop for card sorting
A custom Kano scoring framework for discrete and continuous analysis.
Structure
5 minutes: Intro and warm-up
First 30 minutes: Kano Analysis (Feature Prioritization)
Last 20 minutes: Open Card Sorting (Mental Model Exploration)
Personas Groups
The Petersons
Vesper
Isaac
Priscilla
03.b Kano Analysis - Feature Prioritization
How It Was Conducted
Each participant evaluated 35 potential security features using a structured Kano-inspired questionnaire, presented as a series of interactive slides. This method was used to assess feature desirability and user expectations.
This dual questioning structure allowed me to assign Kano classifications while also gathering real-world commentary to ground responses in personal experience.
03.c Kano Analysis Models
To capture both clear-cut categorizations and subtle preference trends, I used two complementary scoring frameworks:
1. Discrete Kano Model
(Category-Based)
Traditional Kano classification where each feature was assigned to one of the six Kano categories (Must-Be, Attractive, Performance, Indifferent, Reverse, Questionable). For each feature, I then calculated the average percent of respondents that gave each of the available classifications. Finally each feature was assigned to the most common classification that it have been given.
2. Continuous Kano Model
(Scoring-Based)
To revealed nuances in feature prioritization trends beyond simple classification, I applied a numeric scoring model assigning values from –2 to +4 to each response combination. This allowed each feature to be plotted on a desirability scale.
Asymmetrical Weighting Strategy: Because the product goal was adoption and growth, I weighted positive sentiment (Must-Be, Performance, Attractive) more heavily than negative sentiment (Indifferent, Reverse).
Higher scores = Stronger user pull or expectation
Lower scores = Low interest or active rejection
This model revealed relative intensity—some features weren’t just “Attractive,” they were strongly attractive to specific personas.
Prioritize features with adoption-driving potential
Avoid over-penalizing features that some users didn’t actively dislike but didn’t find critical
03.d Kano Analysis Findings
Discrete Kano Model Findings (Categorical Insight)
Using the classic Kano model, I identified clear differences across personas in how security features were perceived. While most features fell into the Indifferent category overall, a few stood out with strong desirability signals.
Performance Features Across Most Personas
Credit Card Protection, Secured Checkout, and Identity Theft Protection Alerts were consistently rated Performance by all groups, meaning users expected these features to work well and saw their value.
Persona-Specific Must-Be and Delighter Features
Continuous Kano Model Findings (Desirability Intensity)
The continuous model surfaced subtler prioritization patterns and revealed intensity levels that the discrete model couldn’t capture.
Universal Must-Haves
Antivirus Protection, Privacy Guard, and Dark Web Monitoring scored as Must-Be across all users—even though they were labeled Indifferent in the discrete model. This indicates that while users didn’t always articulate these needs, they still viewed them as foundational.
Hidden Priorities
Identity Theft Protection Alerts and Password Manager were rated more highly by Issac and the Petersons, even though they were previously labeled Indifferent.
Consistent with the discrete model, the continuous model showed that Vesper and Peterson users expressed stronger desirability across a broader range of features.
Webcam/Microphone Protection was classified as Indifferent in the discrete model but emerged as a Performance or Must-Be feature in the continuous model across all personas.
Model Comparison & Interpretation
The Discrete Model highlighted clear expectations and classification trends, which are useful for early roadmap decisions.
In contrast, the Continuous Model revealed underlying emotional intensity and revealed features that users cared about but didn’t always articulate.
The continuous model also helped correct for subtle biases in interpretation of the Kano format—especially when participants weren’t familiar with certain feature names or didn’t fully understand the impact of a feature.
This gap often appeared when users were familiar with the feature but didn’t emphasize it in their language. A common trait among less technical or more passive users.
Design Implication
Use the Discrete Model to identify baseline expectations and essential features, and the Continuous Model to fine-tune emotional drivers, segmentation strategy, and onboarding priorities across different user groups.
Overall Takeaways from
Kano Analysis
The Kano analysis revealed that while many features were not actively requested, users still expected a baseline level of protection—especially around identity, privacy, and financial safety. Discrete scoring helped highlight which features users noticed and could articulate, while continuous scoring uncovered deeper expectations that weren't always verbalized. In particular, family users (Petersons) and vulnerable seniors (Vespers) prioritized a broader range of protections, while informed users (Issac) responded more critically to value vs. cost.
Across the board, users favored an all-in-one approach that bundled essential protections—showing strong appetite for a modular, unified security app if framed and delivered effectively.
03.e Card Sorting (Mental Model Analysis)
How It Was Conducted
Participants completed an open card sorting exercise using Optimal Workshop, where they were asked to organize 35 security features into categories that made sense to them. This helped us uncover how users naturally think about different types of protection and which features they group together—critical insights for designing intuitive navigation and modular app structure.
Analysis Techniques
I used Optimal Workshop’s 3D cluster view, which builds on the underlying **similarity matrix (**Measured how often two features were grouped together) to show how often participants grouped features together. This visualization revealed natural mental clusters based on actual user behavior—helping us see not just which features belonged together, but also the strength and consistency of those associations.
While Optimal Workshop provides multiple analysis tools, the 3D view offered the most intuitive and visually engaging representation, making it easier to identify cross-persona patterns and structure features into user-friendly modules.
Key Findings
✺
Users organized features by perceived function and personal relevance, not by technical categories.
For example, “Webcam Protection” and “Microphone Protection” were almost always grouped with Privacy Guard and Secure Messaging, suggesting users associate them with personal intrusion prevention rather than system-level protection.
✺
Clusters often reflected tangible threats or life events.
Participants created categories like:
“Identity Protection” → Included features like ID Theft Alerts, Credit Monitoring, Full Identity Restoration
“Payment Safety” → Often included Credit Card Protection, Scam Assist, and Secured Checkout
✺
Several advanced security terms (like "Credential Breach Alerts" or "Biometric Breach Monitoring") were misunderstood or scattered across groups.
This suggests a knowledge gap that could be addressed through onboarding or in-product education, especially for less technical personas.
Persona-Level Observations
Petersons
(Family Users)
Created more categories tied to everyday risks—e.g., kids’ safety, online shopping, fraud prevention. Groupings were intuitive and scenario-based.
Vespers
(Vulnerable Seniors)
Often grouped by ease of understanding—features they recognized (e.g., “Call Blocking”) were grouped tightly, while unfamiliar terms were often left ungrouped or placed randomly.
Issac
(Informed Power Users)
Created precise, system-oriented categories, often mirroring how features might be organized in a professional dashboard or settings panel.
Priscilla
(Passive User)
Created fewer groups overall and often labeled them with broad categories like “Safety” or “Helpful Stuff”—suggesting the need for simpler navigation and pre-bundled recommendations.
Design Implication
These insights directly informed the information architecture for a unified security app. Instead of organizing features by technical domains (e.g., network, device, identity), we explored a modular system based on user mental groupings—like “Identity Protection,” “Security,” “Privacy Settings”, “Protection for me” and “Learning”.
This user-driven structure also supported:
Personalized onboarding, showing only the most relevant feature clusters
Expandable modules that could introduce new services without overwhelming users
Segmented communication strategies for personas with lower tech familiarity
✺
04 Finding Summary
✺
This study revealed how users think about digital security, not just which features they want, but how they expect those features to be organized, delivered, and explained. By combining feature prioritization data with insights into users’ mental models, we uncovered key expectations that shaped both product design and strategy.
04 Key Findings
Baseline protection is expected—even if not explicitly requested.
Features like antivirus and dark web monitoring were often labeled Indifferent, but continuous Kano analysis revealed users saw them as essential.
Different personas prioritize differently.
Family users and vulnerable seniors valued a broader set of protections. Power users were more selective, emphasizing functionality and pricing.
Users think in terms of life situations, not technical categories.
Card sorting showed users grouped features by scenarios like identity theft, financial safety, or child protection—not by system architecture.
Feature names affected perceived value.
Advanced tools like biometric breach alerts were deprioritized when users didn’t fully understand what they did—pointing to a gap in education and onboarding.
Security is seen as cross-platform, not mobile-specific.
Users viewed digital protection holistically, influencing a strategic pivot away from a mobile-first approach.
Users preferred an all-in-one, modular security app.
This validated the unification of Malwarebytes Antivirus and PrivacyVPN into MB5, and informed the modular UX framework later used for SMB offerings.
✺
05 Impact
✺
Immediate Impact
PMs and leadership reconsidered the mobile-first strategy, shifting to a broader security approach.
Informed Project Flywheel and the design direction of MB5 (Malwarebytes 5.0).
Supported UX decisions around onboarding, information architecture, and feature bundling.
Long-Term Impact
3 years later, Malwarebytes launched Identity Protection (Identity Theft Protection, Personal Data Remover, Dark Web Monitoring, etc)—features that aligned with findings from this study.
The study validated the all-in-one modular security approach, which later influenced SMB product designs.
✺
06 Reflection
✺
06 What Worked Well?
Two Kano models (Discrete & Continuous) provided richer insights.
Segmenting results by persona revealed critical differences in user needs.
Findings directly influenced strategic shifts.
What I Would Change?
While the depth of the 1:1 sessions added immense value, conducting all 32 interviews myself made this project especially time-intensive. If I were to do it again, I would explore using a semi-moderated survey approach—combining open-ended questions with structured card sorting and Kano-style feature evaluation in an asynchronous format.
This would allow us to reach a broader sample with fewer scheduling constraints while still capturing both qualitative insights and quantifiable data. I’d still keep a smaller subset of live interviews to gather rich context, but using a hybrid method could significantly improve scalability without sacrificing depth.
© 2025 Alexandra Zhao


Projects
ABOUT
Resume
Connect


Kano Analysis
Open Card Sorting
UX Researcher
✺
2022 May
✺
01 From Research to Roadmap
A mixed-methods study that translated mental model to an unified security solution
01 Background
After securing new funding, Malwarebytes began exploring ways to expand its security offerings, especially with a possible mobile-first strategy. While the engineering team was conducting feasibility test, the product team needed clear direction on what users actually wanted.
Prior competitor research pointed toward an all-in-one modular security app as a promising direction, but we lacked direct input from users to confirm whether that structure along with the features inside it, would truly make sense to them. Most importantly, we didn’t know which security and privacy needs users found essential, nice-to-have, or unnecessary, or how they naturally grouped and understood these services. This study was launched to fill that gap and ensure our next steps were aligned with user expectations.

Quick Jump
02 Study Objectives
To address these gaps, I designed a mixed-method study to provide user-centered insights that would guide product development and strategy. Specifically, the study aimed to:
Prioritize 35 security/privacy features based on user needs and expectations.
Understand user mental models to inform the architecture of a unified security app.
Uncover unmet consumer security/privacy needs to refine long-term strategy.
Identify consumer profiles most likely to purchase each portfolio offering to complement targeted marketing and monetization strategies.
✺
03 Methodology
✺
03.a Research Approach
To uncover how users think about digital security and prioritize different features, I designed a two-part study combining qualitative depth with structured, quantifiable input: one-on-one interviews to gave us a window into users’ real-world behaviors and language; and a follow-up card sorting and feature-ranking exercise to map out their mental models that could guide both design and product strategy.
Participants
32 1:1 moderated interviews
8 participants per persona group
Tools
PowerPoint for structured feature slides
Optimal Workshop for card sorting
A custom Kano scoring framework for discrete and continuous analysis.
Structure
5 minutes: Intro and warm-up
First 30 minutes: Kano Analysis (Feature Prioritization)
Last 20 minutes: Open Card Sorting (Mental Model Exploration)
Personas Groups
The Petersons
Vesper
Isaac
Priscilla
03.b Kano Analysis - Feature Prioritization
How It Was Conducted
Each participant evaluated 35 potential security features using a structured Kano-inspired questionnaire, presented as a series of interactive slides. This method was used to assess feature desirability and user expectations.
This dual questioning structure allowed me to assign Kano classifications while also gathering real-world commentary to ground responses in personal experience.
03.c Kano Analysis Models
To capture both clear-cut categorizations and subtle preference trends, I used two complementary scoring frameworks:
1. Discrete Kano Model
(Category-Based)
Traditional Kano classification where each feature was assigned to one of the six Kano categories (Must-Be, Attractive, Performance, Indifferent, Reverse, Questionable). For each feature, I then calculated the average percent of respondents that gave each of the available classifications. Finally each feature was assigned to the most common classification that it have been given.
2. Continuous Kano Model
(Scoring-Based)
To revealed nuances in feature prioritization trends beyond simple classification, I applied a numeric scoring model assigning values from –2 to +4 to each response combination. This allowed each feature to be plotted on a desirability scale.
Asymmetrical Weighting Strategy: Because the product goal was adoption and growth, I weighted positive sentiment (Must-Be, Performance, Attractive) more heavily than negative sentiment (Indifferent, Reverse).
Higher scores = Stronger user pull or expectation
Lower scores = Low interest or active rejection
This model revealed relative intensity—some features weren’t just “Attractive,” they were strongly attractive to specific personas.
Prioritize features with adoption-driving potential
Avoid over-penalizing features that some users didn’t actively dislike but didn’t find critical
03.d Kano Analysis Findings
Discrete Kano Model Findings (Categorical Insight)
Using the classic Kano model, I identified clear differences across personas in how security features were perceived. While most features fell into the Indifferent category overall, a few stood out with strong desirability signals.
Performance Features Across Most Personas
Credit Card Protection, Secured Checkout, and Identity Theft Protection Alerts were consistently rated Performance by all groups, meaning users expected these features to work well and saw their value.
Persona-Specific Must-Be and Delighter Features
Continuous Kano Model Findings (Desirability Intensity)
The continuous model surfaced subtler prioritization patterns and revealed intensity levels that the discrete model couldn’t capture.
Universal Must-Haves
Antivirus Protection, Privacy Guard, and Dark Web Monitoring scored as Must-Be across all users—even though they were labeled Indifferent in the discrete model. This indicates that while users didn’t always articulate these needs, they still viewed them as foundational.
Hidden Priorities
Identity Theft Protection Alerts and Password Manager were rated more highly by Issac and the Petersons, even though they were previously labeled Indifferent.
Consistent with the discrete model, the continuous model showed that Vesper and Peterson users expressed stronger desirability across a broader range of features.
Webcam/Microphone Protection was classified as Indifferent in the discrete model but emerged as a Performance or Must-Be feature in the continuous model across all personas.
Model Comparison & Interpretation
The Discrete Model highlighted clear expectations and classification trends, which are useful for early roadmap decisions.
In contrast, the Continuous Model revealed underlying emotional intensity and revealed features that users cared about but didn’t always articulate.
The continuous model also helped correct for subtle biases in interpretation of the Kano format—especially when participants weren’t familiar with certain feature names or didn’t fully understand the impact of a feature.
This gap often appeared when users were familiar with the feature but didn’t emphasize it in their language. A common trait among less technical or more passive users.
Design Implication
Use the Discrete Model to identify baseline expectations and essential features, and the Continuous Model to fine-tune emotional drivers, segmentation strategy, and onboarding priorities across different user groups.
Overall Takeaways from
Kano Analysis
The Kano analysis revealed that while many features were not actively requested, users still expected a baseline level of protection—especially around identity, privacy, and financial safety. Discrete scoring helped highlight which features users noticed and could articulate, while continuous scoring uncovered deeper expectations that weren't always verbalized. In particular, family users (Petersons) and vulnerable seniors (Vespers) prioritized a broader range of protections, while informed users (Issac) responded more critically to value vs. cost.
Across the board, users favored an all-in-one approach that bundled essential protections—showing strong appetite for a modular, unified security app if framed and delivered effectively.
03.e Card Sorting (Mental Model Analysis)
How It Was Conducted
Participants completed an open card sorting exercise using Optimal Workshop, where they were asked to organize 35 security features into categories that made sense to them. This helped us uncover how users naturally think about different types of protection and which features they group together—critical insights for designing intuitive navigation and modular app structure.
Analysis Techniques
I used Optimal Workshop’s 3D cluster view, which builds on the underlying **similarity matrix (**Measured how often two features were grouped together) to show how often participants grouped features together. This visualization revealed natural mental clusters based on actual user behavior—helping us see not just which features belonged together, but also the strength and consistency of those associations.
While Optimal Workshop provides multiple analysis tools, the 3D view offered the most intuitive and visually engaging representation, making it easier to identify cross-persona patterns and structure features into user-friendly modules.
Key Findings
✺
Users organized features by perceived function and personal relevance, not by technical categories.
For example, “Webcam Protection” and “Microphone Protection” were almost always grouped with Privacy Guard and Secure Messaging, suggesting users associate them with personal intrusion prevention rather than system-level protection.
✺
Clusters often reflected tangible threats or life events.
Participants created categories like:
“Identity Protection” → Included features like ID Theft Alerts, Credit Monitoring, Full Identity Restoration
“Payment Safety” → Often included Credit Card Protection, Scam Assist, and Secured Checkout
✺
Several advanced security terms (like "Credential Breach Alerts" or "Biometric Breach Monitoring") were misunderstood or scattered across groups.
This suggests a knowledge gap that could be addressed through onboarding or in-product education, especially for less technical personas.
Persona-Level Observations
Petersons
(Family Users)
Created more categories tied to everyday risks—e.g., kids’ safety, online shopping, fraud prevention. Groupings were intuitive and scenario-based.
Vespers
(Vulnerable Seniors)
Often grouped by ease of understanding—features they recognized (e.g., “Call Blocking”) were grouped tightly, while unfamiliar terms were often left ungrouped or placed randomly.
Issac
(Informed Power Users)
Created precise, system-oriented categories, often mirroring how features might be organized in a professional dashboard or settings panel.
Priscilla
(Passive User)
Created fewer groups overall and often labeled them with broad categories like “Safety” or “Helpful Stuff”—suggesting the need for simpler navigation and pre-bundled recommendations.
Design Implication
These insights directly informed the information architecture for a unified security app. Instead of organizing features by technical domains (e.g., network, device, identity), we explored a modular system based on user mental groupings—like “Identity Protection,” “Security,” “Privacy Settings”, “Protection for me” and “Learning”.
This user-driven structure also supported:
Personalized onboarding, showing only the most relevant feature clusters
Expandable modules that could introduce new services without overwhelming users
Segmented communication strategies for personas with lower tech familiarity
✺
04 Finding Summary
✺
This study revealed how users think about digital security, not just which features they want, but how they expect those features to be organized, delivered, and explained. By combining feature prioritization data with insights into users’ mental models, we uncovered key expectations that shaped both product design and strategy.
04 Key Findings
Baseline protection is expected—even if not explicitly requested.
Features like antivirus and dark web monitoring were often labeled Indifferent, but continuous Kano analysis revealed users saw them as essential.
Different personas prioritize differently.
Family users and vulnerable seniors valued a broader set of protections. Power users were more selective, emphasizing functionality and pricing.
Users think in terms of life situations, not technical categories.
Card sorting showed users grouped features by scenarios like identity theft, financial safety, or child protection—not by system architecture.
Feature names affected perceived value.
Advanced tools like biometric breach alerts were deprioritized when users didn’t fully understand what they did—pointing to a gap in education and onboarding.
Security is seen as cross-platform, not mobile-specific.
Users viewed digital protection holistically, influencing a strategic pivot away from a mobile-first approach.
Users preferred an all-in-one, modular security app.
This validated the unification of Malwarebytes Antivirus and PrivacyVPN into MB5, and informed the modular UX framework later used for SMB offerings.
✺
05 Impact
✺
Immediate Impact
PMs and leadership reconsidered the mobile-first strategy, shifting to a broader security approach.
Informed Project Flywheel and the design direction of MB5 (Malwarebytes 5.0).
Supported UX decisions around onboarding, information architecture, and feature bundling.
Long-Term Impact
3 years later, Malwarebytes launched Identity Protection (Identity Theft Protection, Personal Data Remover, Dark Web Monitoring, etc)—features that aligned with findings from this study.
The study validated the all-in-one modular security approach, which later influenced SMB product designs.
✺
06 Reflection
✺
06 What Worked Well?
Two Kano models (Discrete & Continuous) provided richer insights.

Segmenting results by persona revealed critical differences in user needs.
Findings directly influenced strategic shifts.
What I Would Change?
While the depth of the 1:1 sessions added immense value, conducting all 32 interviews myself made this project especially time-intensive. If I were to do it again, I would explore using a semi-moderated survey approach—combining open-ended questions with structured card sorting and Kano-style feature evaluation in an asynchronous format.
This would allow us to reach a broader sample with fewer scheduling constraints while still capturing both qualitative insights and quantifiable data. I’d still keep a smaller subset of live interviews to gather rich context, but using a hybrid method could significantly improve scalability without sacrificing depth.
© 2025 Alexandra Zhao
